Reporting Cyber Risk: The Top 5 Dashboards for CISO Success
The CISO’s role is quickly moving away from a technical subject matter expert to an enterprise risk executive as they are expected to address cybersecurity threats as an enterprise risk and protect shareholder value. Regulators are starting to enforce prompt cybersecurity incident reporting and pushing organizations to prove the efficiency of their cyber risk management.
Yesterday’s solutions are no longer sufficient to support today’s CISOs. They require a single, centralized platform that provides them with:
- Visibility of their enterprise-wide cyber risk
- Insights to help them prioritize risk management and ensure the greatest return on investment (of time, talent, and technology)
- Quantified real-time metrics to communicate cybersecurity exposure to the Board and CXOs.
Introducing SAFE: Your Ally in the Boardroom and Beyond
We created SAFE to empower security and risk management leaders to quantifiably measure, manage, and mitigate cybersecurity risk in real-time. SAFE offers an always-on, continuous, and dynamic assessment of your business’ cybersecurity threats via five dashboards.
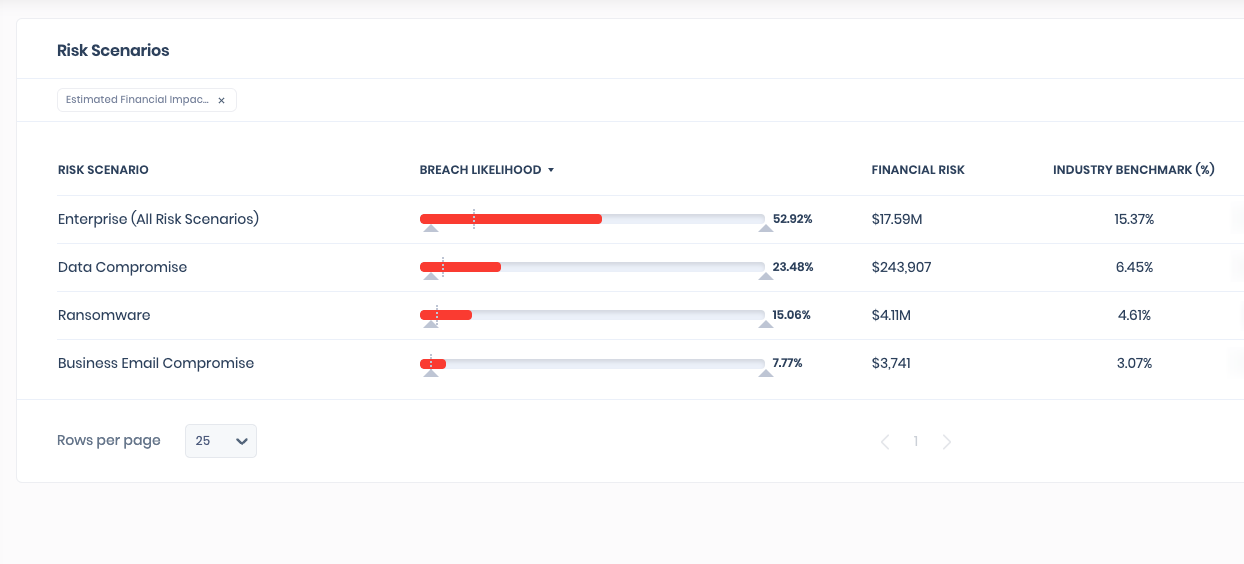
Dashboard 1: Cyber Risk Scenarios
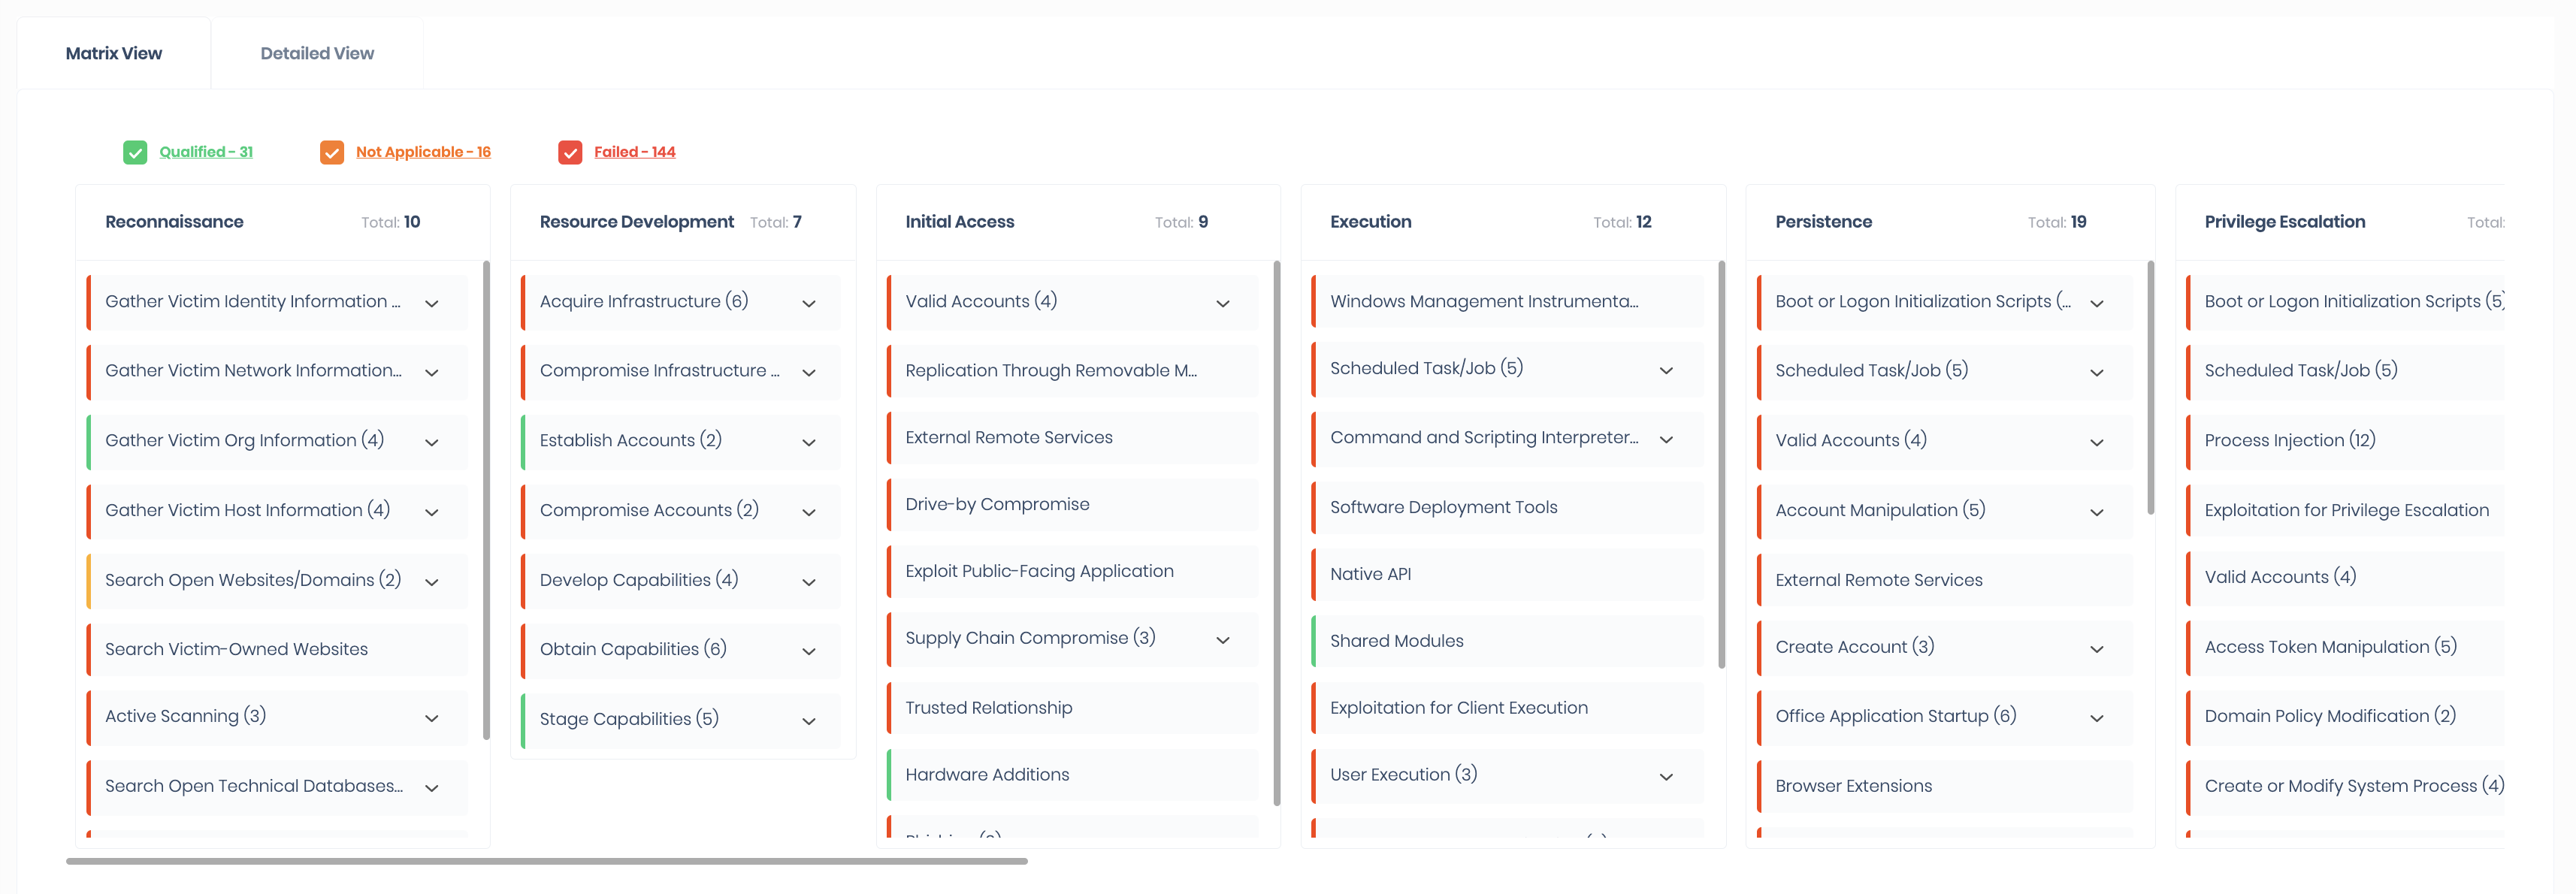
SAFE continuously monitors and updates top cyber risk scenarios by correlating all of your security findings to their respective MITRE ATT&CK TTPs (Tactics, Techniques & Procedures).
The core cyber risk scenarios covered within SAFE are:
- Enterprise
- Ransomware
- Data Compromise
- Business Email Compromise.
SAFE quantifies the risk posed by each cyber risk scenario to calculate:
- Your personalized SAFE Score: a real-time, always-on measurement of your cyber risk posture
- How likely your business is to be breached (breach likelihood)
- The associated financial risk and estimated financial impact of a potential breach
You can view your cyber risk scenarios “summary” on the main SAFE Dashboard. You can also expand the details of the individual cyber risk scenarios page by clicking on the desired scenario.
Dashboard 2: The SAFE Score
SAFE’s scoring model estimates your organization’s breach likelihood by taking input from adversarial behaviors (techniques) and objectives (tactics). Each cyber risk scenario is evaluated against external threat intelligence frameworks such as the MITRE ATT&CK® framework to predict an adversary’s behavior for each risk scenario.
You can find the SAFE Score on the main dashboard as soon as you log in to SAFE
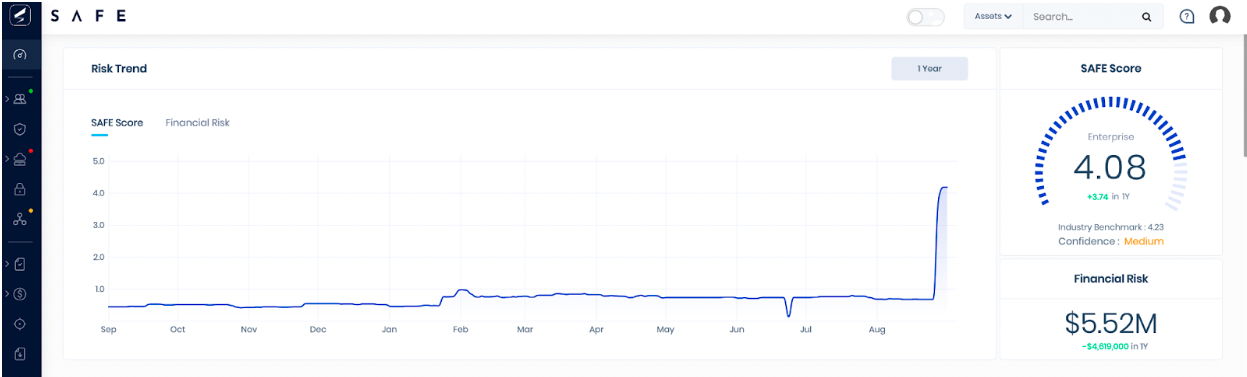
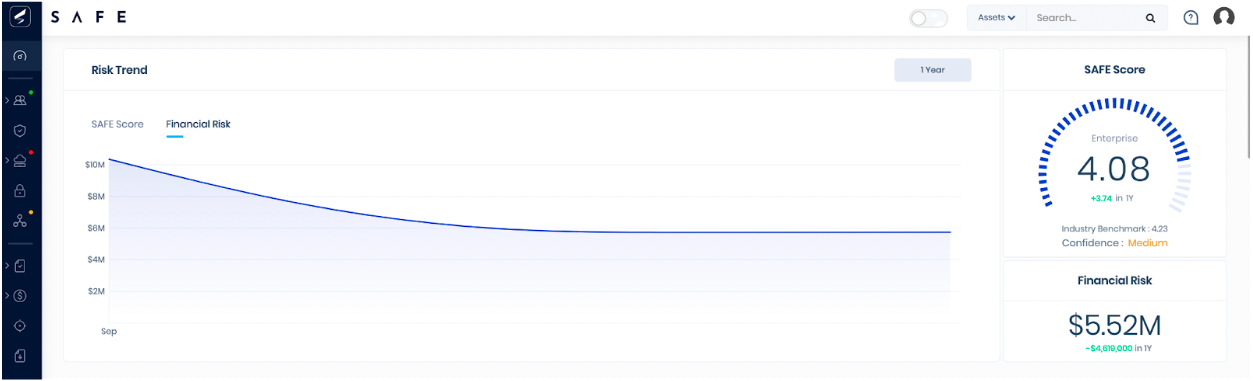
Dashboard 3: Financial Risk
Financial risk represents the expected financial loss an enterprise can incur in case of a breach over twelve months.
SAFE demonstrates your organization’s financial risk trend and current financial risk for each cyber risk scenario.
You can find your financial risk trend, current financial risk exposure, and cyber risk scenarios on your main dashboard.
Dashboard 4: Estimated Financial Impact (EFI) and Interactive Cost Model
SAFE now calculates and displays the Estimated Financial Impact (EFI) per cyber risk scenario (the dollar value impact an enterprise may incur due to a breach). This value is provided as a range with upper and lower bounds of financial impact and an expected mean. SAFE auto-generates the inherent EFI for a risk scenario based on your company characteristics, security findings, and applicable cost drivers.
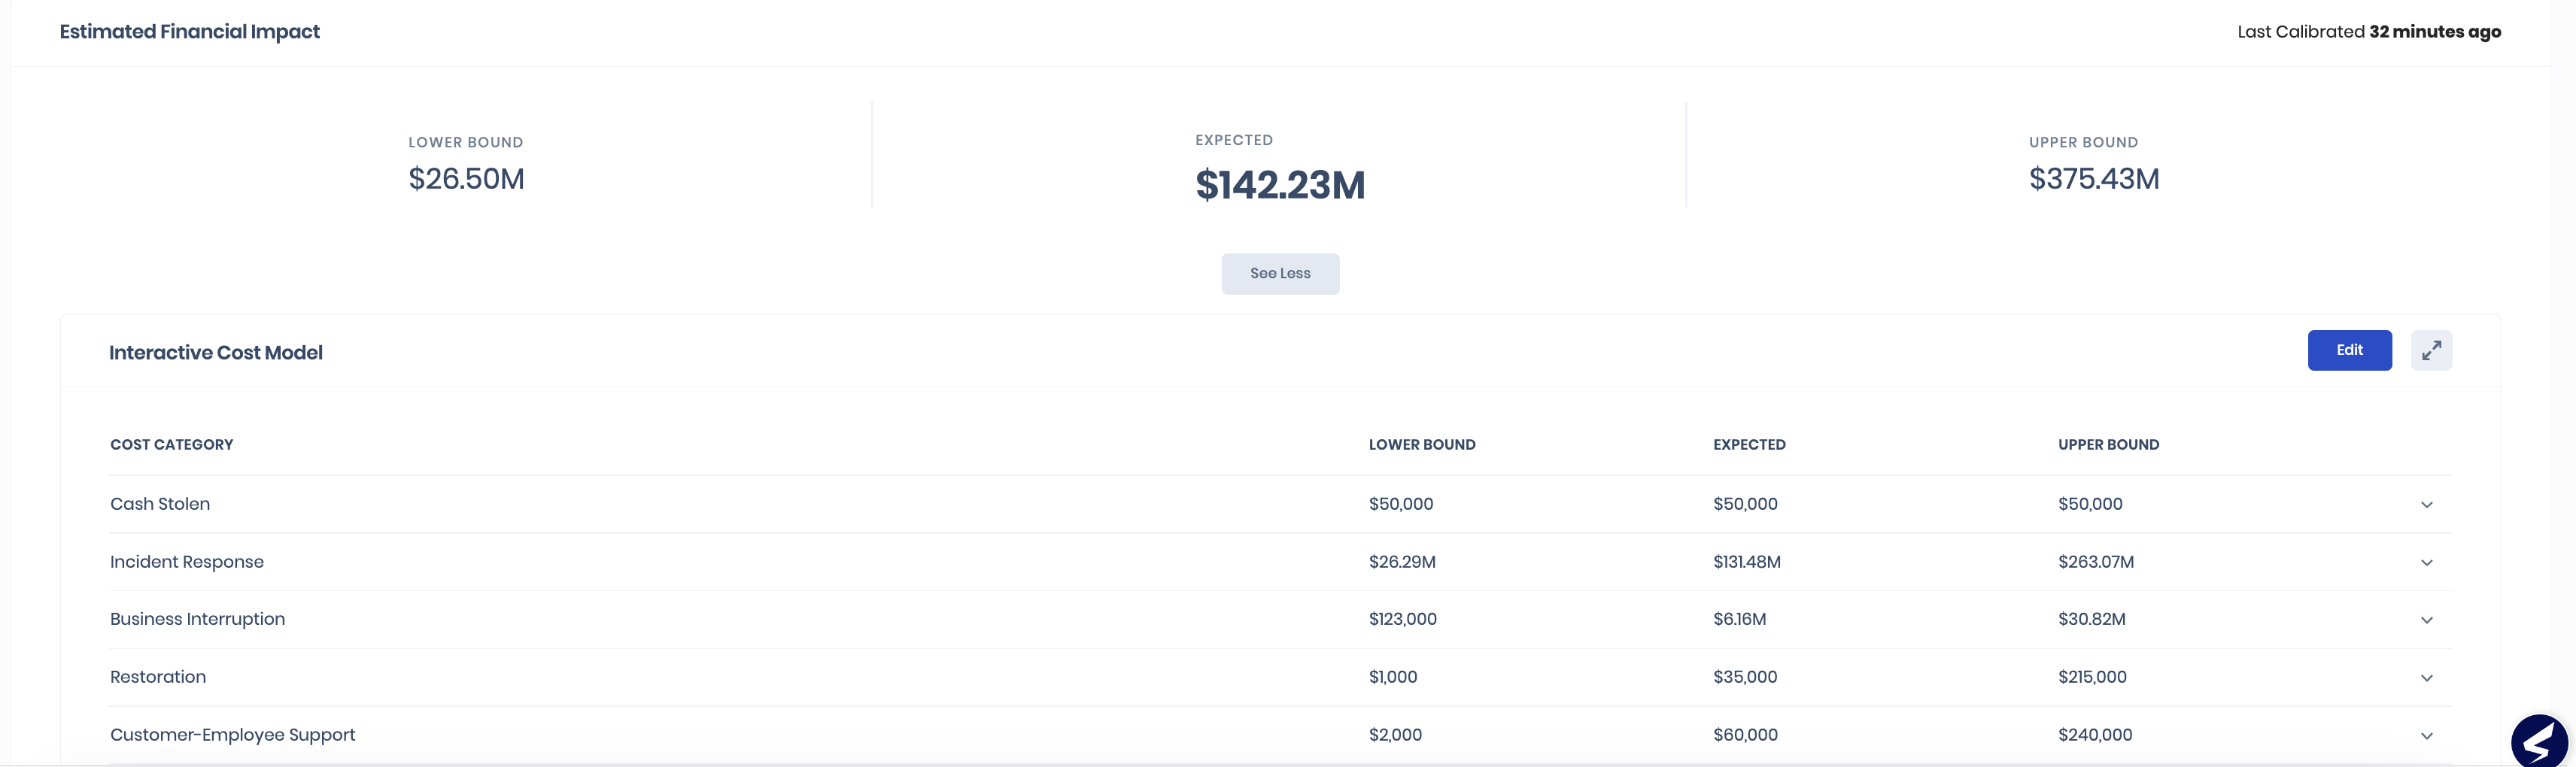
SAFE’s Financial Risk Calculation is powered by the Interactive Cost Model (ICM). It is the first interactive, transparent, and trustable cost model calculating dollar-value risk per attack vector. It can conform to different internal assumptions for cost modeling. A user can provide upper bound, lower bound, and expected values for all the tunable cost drivers. Based on the inputs, EFI and, subsequently, the financial risk shall be calibrated for each cyber risk scenario.
The ICM leverages SAFE’s proprietary database – built and maintained by our expert analysts and threat intelligence teams. The model leverages:
- Over 500000 data points across 2000 mapped discrete incidents taken from primary sources
- ~1300 CVEs identified as seen in the wild., and over 1100 attack groups, including identified aliases
- TTP mapping to MITRE ATT&CK for over 100 attack groups and malware (and counting)
- A pipeline of over 25000 security incidents is being actively reconciled and processed.
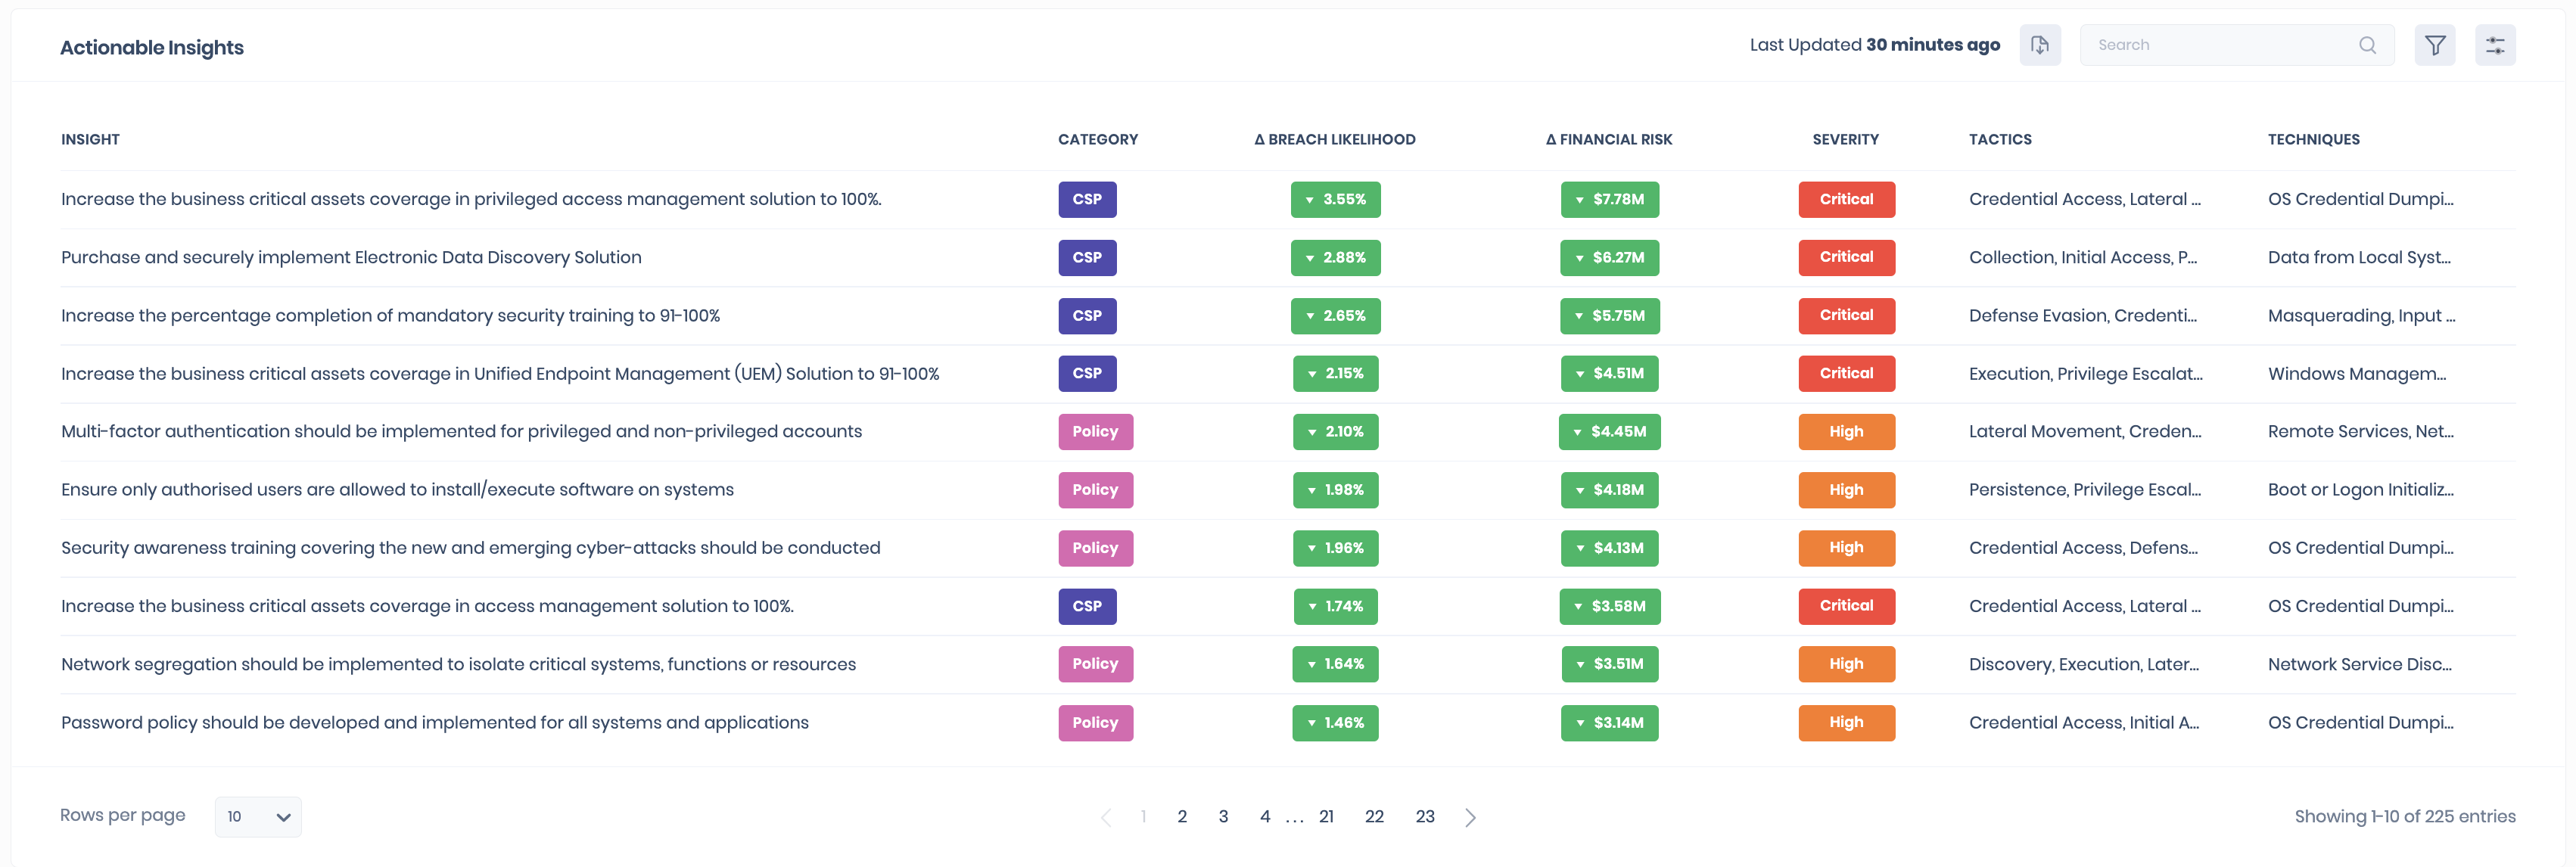
Dashboard 5: Actionable Insights and your Return On Security Investments
SAFE displays all security findings that need immediate attention as prioritized actionable insights. A prioritized list of up to 100 actionable insights helps you measure, manage and mitigate the security findings that have been identified.
These combine all critical failing controls which are ranked according to the resultant delta in financial risk. Controls that result in greater financial risk reduction are prioritized to provide visibility into your Return on Security Investment (ROSI). As a result, CISOs can measure and understand which security initiatives yield the greatest returns, powered by SAFE’s Return On Security Investment Calculator.
These insights are available within your main dashboard for enterprise cyber risk scenarios and the individual cyber risk scenario dashboard for ransomware, data compromise, and business email compromise.
Take control of your Cyber Risk Management Program in just four weeks
With SAFE, CISOs have the necessary tools and intelligence to measure, manage, and mitigate cybersecurity risk.
Driven by their business’ objectives, cybersecurity appetite, and risk tolerance, CISOs can:
- Visualize enterprise-wide and real-time cybersecurity risk posture
- Prioritize cyber risk management and justify cybersecurity budget and initiatives
- Engage in dollar-driven cybersecurity discussions
Want to know more?
- Discover how SAFE can show value to your organization in just four weeks with its Crawl, Walk, Run, Fly approach and regain control of your cyber risk posture within days.
- Learn how to tackle attack surface expansion by translating security signals into risk.
- Struggling to implement FAIR practically? SAFE does it for you.