What’s the Difference? Qualitative vs. Quantitative Risk Analysis
Hint: Quantification best supports business decisions
NIST CSF, ISO 2700X, and other standards say that cybersecurity risk and its contributing factors can be assessed in a variety of ways, including “quantitatively” or “qualitatively.” But what’s the difference? Which is the better form of risk measurement for your organization? Why would you conduct a qualitative versus a quantitative risk analysis?
Let’s explore the differences between quantitative and qualitative risk analysis.
Qualitative Cyber Risk Analysis
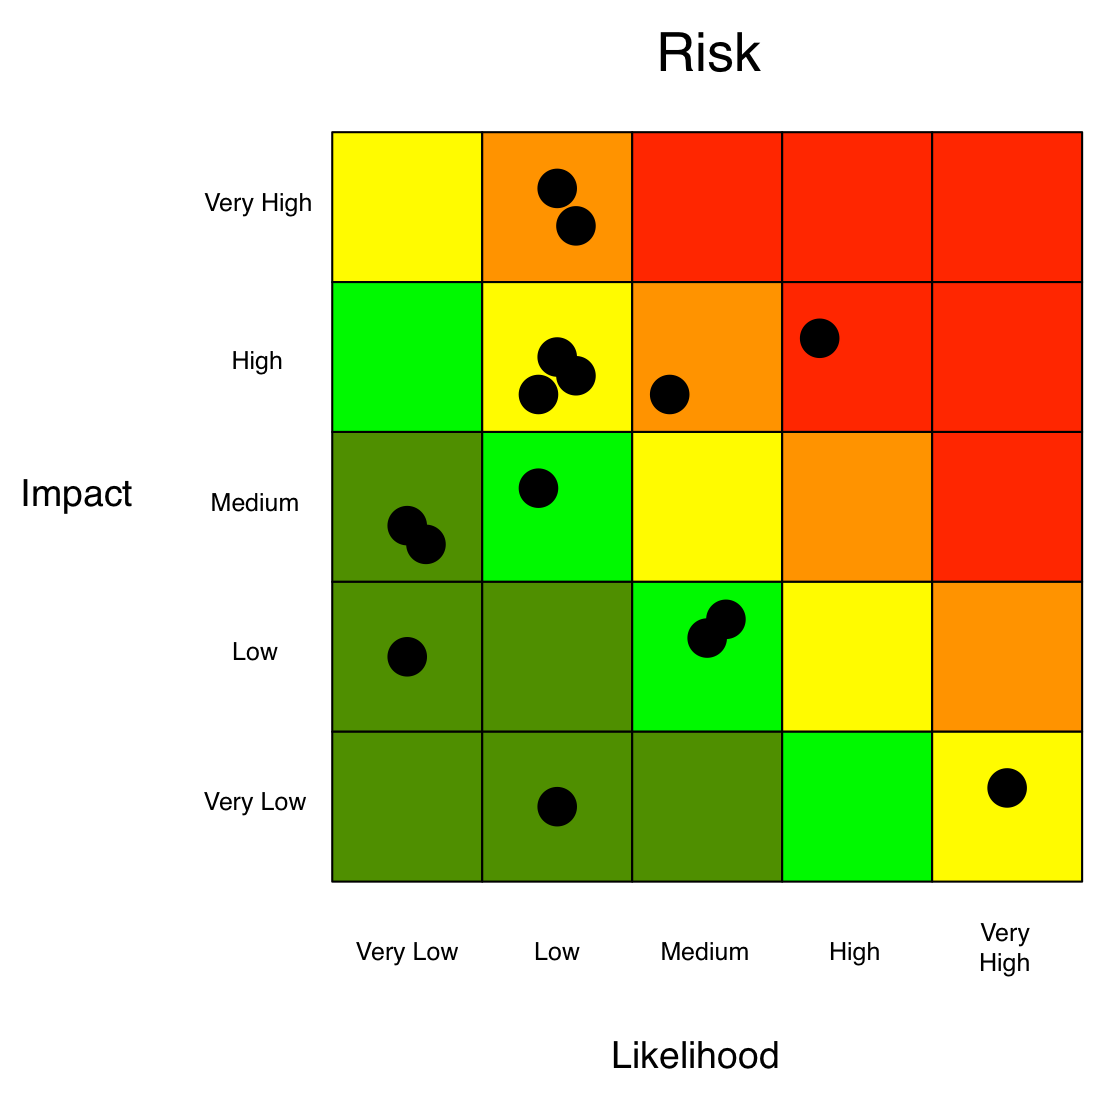
Analysts use ordinal rating scales (1 – 5) or assign relative ratings (high, medium, low, or red, yellow, green) to plot various risks on a heat map with Loss Event Frequency (or Likelihood) on one axis and Loss Severity (or Magnitude or Impact) on the other.
But how do analysts decide where to place the risks relative to each other? They decide based on their experience in risk management or — as Jack Jones writes in his book Measuring and Managing Information Risk: A FAIR Approach — their “mental models.” In other words, these decisions are made based solely on the opinions of the people conducting the assessment.
Purely qualitative analyses are inherently subjective. This makes prioritizing risks a challenge. How do you determine, for instance, which red risk is the “most red?” Second, there is also no systemic way to account for the accumulation of risk (e.g., does yellow times yellow equal a brighter yellow?). Finally, there is a tendency to gravitate toward the worst-case scenario for Loss since analysts are forced to choose a specific value (e.g., red, yellow, green) versus assigning a value along a continuum.
As a result, ratings are subject to bias, poorly defined models, and undefined assumptions.
What Should a Risk Model Do?
“A model is a simplified representation of a more complex reality. It should support analysis by describing how things are related. Common security frameworks are not analytic models because they don’t define relationships, they categorize.
“It must be scenario-based so you are measuring the frequency and magnitude of loss event scenarios. If a model isn’t scenario-based, I don’t see how the results could be legitimate.
“It also should faithfully account for uncertainty using ranges or distributions as inputs and outputs, not as discrete values.
“The rationale for the inputs — why you chose your data range and so forth — should be open for examination. If analysis was done and there is no rationale, then you should be leery of the output.”
–Jack Jones, creator of the FAIR model
What Is a Risk (or Loss Event) Scenario?
The building blocks of quantitative cyber risk analysis are risk scenarios that clearly state factors that we can quantify in percentage or dollar terms for likelihood and impact. Here’s a risk scenario template:
Threat Actor (attacks) >> Business Resource (with) >> Initial Attack Method (leading to) >> Attack Outcome (with) >> Loss Effect
Example: Malicious Cyber Criminals >> IP & Trade Secrets >> Phishing >> Ransomware with Data Exfiltration >> Loss of Integrity
Quantitative Cyber Risk Analysis
Instead of mental models that vary by analyst, the quantitative approach runs on a standard model that any analyst can use to produce consistent results. At SAFE, we use the FAIR™ model — that’s Factor Analysis of Information Risk — to perform quantitative assessments using the best available models and techniques.
FAIR takes the guesswork out of the concepts of Loss Event Frequency (or Likelihood) and Loss Magnitude, the two main components of Risk that are also leveraged in qualitative analysis. The difference is that ranges or distributions are used to capture high and low ends of possible outcomes rather than discrete values.
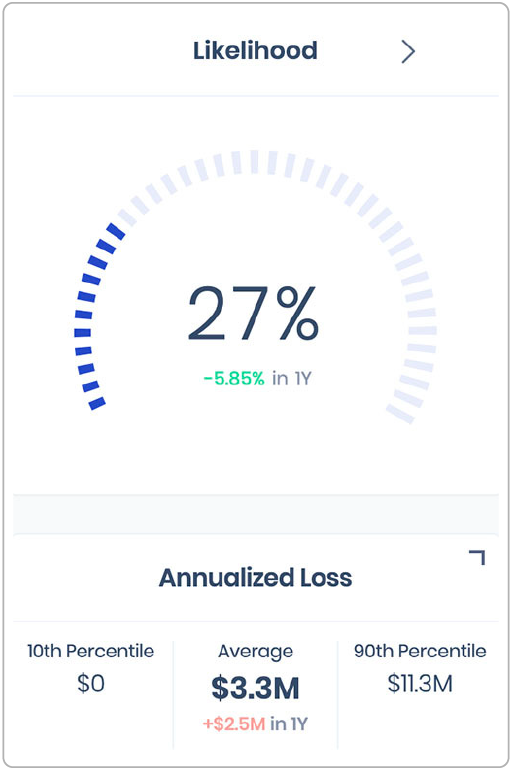
Various iterations of these inputs are then run through a Monte Carlo engine. The result is not a simple two-axis heat map, but a range of probable outcomes, as in this output from analysis on the SAFE platform.
The model breaks down these two factors into subcomponents that can be estimated based on information collected from telemetry from attack surfaces, controls, or other sources, plus subject-matter experts in the company and industry-standard data, then builds them back up into accurate, overall estimates of Frequency (percentage probability of occurrence in a year) and Magnitude (in terms of dollars and cents of loss, annualized).
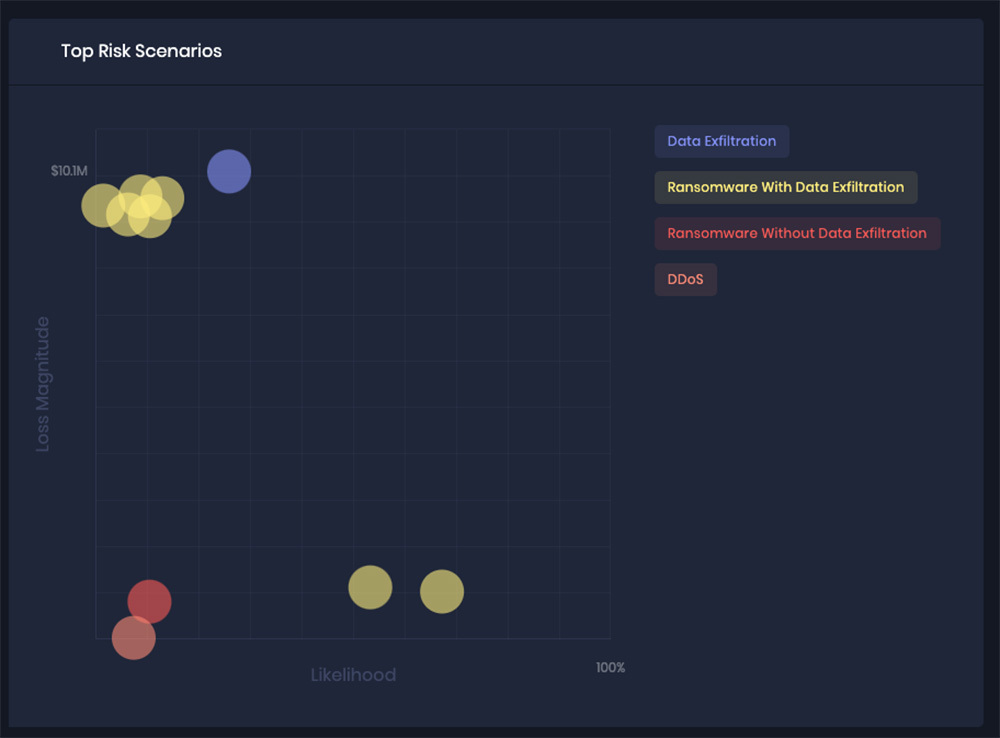
By using a probability distribution to identify the impact of potential risks, the FAIR model offers reliable data that can be used to inform business decisions with something more tangible and accurate than color categories — for instance, top risks ranked for probability and impact, as shown in this output from the SAFE platform:
Where Does the Frequency and Magnitude Data Come from?
Data is critical to getting the most out of risk quantification; it must be accurate and recent. The SAFE platform leverages two recent breakthroughs in the development of FAIR analysis.
FAIR-CAM™ (FAIR Controls Analytics Model) corrects the serious defect in qualitative analysis that the analyst must just take a guess at the effectiveness of controls in reducing frequency or magnitude of cyber loss events. FAIR-CAM adds quantification by
- Enabling empirical measurement of control efficacy and value
- Accounting for individual control functionality as well as systemic effects
- Effectively leveraging cybersecurity telemetry
FAIR-MAM™ (FAIR Materiality Assessment Model) likewise eliminates the uncertainty involved in guessing what costs need to be factored in the case of cyber incidents and their magnitude. With FAIR-MAM, SAFE measures cyber losses and materiality like a CFO would.
- FAIR-MAM is an open, financial loss model that enables organizations to reliably quantify the impact of cyber incidents.
- The model is composed of 10 primary cost modules (Business Interruption, Proprietary Data Loss, etc.) that can be customized to any organization’s cost structures.
- SAFE provides benchmark loss data based on FAIR-MAM cost categories out-of-the-box.
The Bottom Line
The attractiveness of qualitative heat maps or high-medium-low ranking is that they’re fast and easy. The problem is, they don’t force you to uncover the assumptions behind them – and people typically come at risk assessment with different assumptions. That can lead to mis-prioritizing of risks.
Secondly, qualitative approaches don’t enable sound decision-making. How much should you spend to mitigate a “high” risk and how would you know when it went so high as to be a material risk?
To make actual business decisions based on accurate estimation of impact, you need to quantify risk in financial terms, using a standard methodology that removes subjectivity. FAIR is the recognized standard for cyber risk quantification. Contact us for a demo of FAIR risk quantification in action.